4
th
RINA High Performance Yacht Design Conference Auckland, 12-14 March, 2012
TUNING OF APPENDAGES FOR AN IMOCA60 YACHT
Merfyn Owen
1
merf@owenclarkedesign.com,
Ian Campbell
2
imc@soton.ac.uk,
Clay Oliver
3
clayoliver1@gmail.com
,
Giorgio Provinciali
4
g.provinciali@gmail.com
,
Abstract
The IMOCA60 Class has a complicated set of appendages: with canted and tilted keels, cambered dagger-boards that can be designed to be fitted to the hull in different orientations and toed in and twin rudders that can also be configured in different orientations. The relative balance between the appendages varies with boat speed and is also affected by the running trim of the boat, which varies with the hull design and ballast tank usage. This paper describes the development process that was followed to tune the appendage configurations for a new Owen Clarke design, starting from the known performance of previous designs, through VPP predictions and sail selection charts for different sailing conditions to tank test setups and CFD calculations of relative appendage loadings. Results from tests and calculations will be presented with discussion of correlation of findings, tempered by the reality of knowledge from sailing these high-performance ocean racing yachts
NOMENCLATURE
λ Leeway angle TWA True wind angle – degrees TWS True wind speed - knots
1. INTRODUCTION
To an engineer yachts are remarkable in the way in which they achieve equilibrium between the aerodynamic sail forces, the hydrodynamic hull and appendage forces and the associated heeling moments and hydrostatic stability. They provide a perfect analogue solution to the problem that a VPP solves digitally and sometimes imperfectly. An IMOCA60 will sail at the appropriate speed for the wind conditions with the correct heel, bow up trim and leeway angles, although sailors will seek to improve the speed by making adjustments to what is under their control, principally the sails but for an IMOCA60 also the dagger-boards. The difficulty for the yacht designer and engineers is to be able to separate the various factors that influence performance and reassemble a better package that will sail faster at sea.
The problem of dealing with different factors was illustrated dramatically by two consecutive runs in the towing tank, conducted to investigate the effect of an interceptor at 26 knots. Interceptors are effective at controlling trim and reducing resistance at 16 knots but revisions to the IMOCA60 Rules required them to be fixed so they could not, as normally operated, be raised at high speeds. Without interceptors the bow trimmed up by 2.7 degrees at 26 knots, which affected the flow angle on the canting keel and produced twice the required equilibrium sideforce. Fitting the interceptors caused a bow down trim of 0.4 degrees, immersing the stem and driving spray upwards, but this trim change also altered
1 Owen Clarke Design 2 Emeritus Fellow, Wolfson Unit MTIA 3 Yacht Research International 4 Consultant
The flow angle on the canting keel such that more sideforce was generated but opposite to the required direction. The yacht, provided it did not broach, would have automatically adjusted its leeway to achieve the equilibrium sideforce, albeit with bow down trim but the leeway is fixed in tank tests and has to be adjusted prior to a run to be set close to where the yacht would sail. Whilst the leeway was clearly incorrectly set for second tank run it nevertheless demonstrated the overly powerful trim effect of the interceptors and the interaction between leeway, keel tilt and sailing trim.
2. DESIGN TOOLS
Owen Clarke’s current IMOCA60 design started with the known performance of their previous designs, including ECOVER 3, compared to that of more recent boats from other designers. One of the parameters that has changed in recent IMOCA60 designs, including ECOVER 3, is increasing fore and aft inclination of the canting keel pivot axis to DWL or its tilt, which changes the trim of the boat. Anecdotal information indicated that whilst increasing keel tilt improved reaching performance at 16 knots excessive tilt could lead to control problems when sailing downwind at higher speeds so the design study had to cover the full range of speeds for the boat from 9 to 28 knots.
VPP calculations, based on hydrodynamic data from previous tank tests, were performed and some adjustments made to match the performance to that of ECOVER 3. This tricky job was performed using the WinDesign VPP with special features to match the canting keel effects on stability and different floatations to match the various water ballast configurations for the boat. Detailed output from the VPP was used to provide input to the tank tests and CFD calculations.
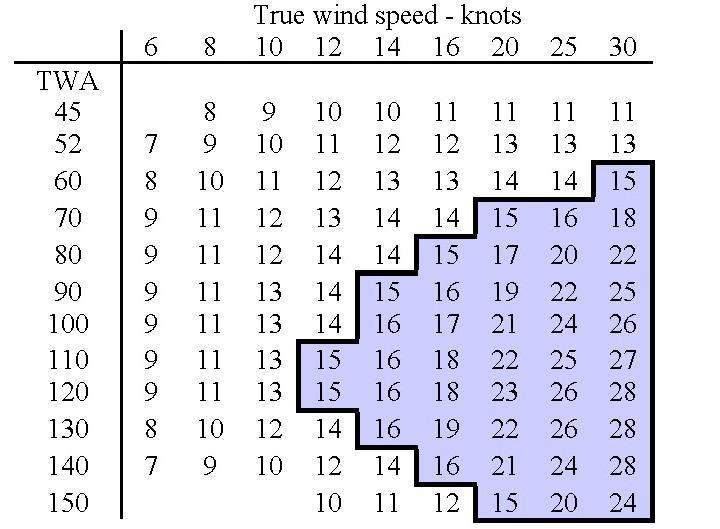
Tank tests were conducted using 1:7 scale models to evaluate the resistance characteristics of different hull forms but these tests are complicated to conduct with dagger-boards, however the boards are mostly deployed for sailing upwind and the canting keel alone provides sufficient sideforce for, reaching and downwind Vmg sailing at speeds above 15 knots, which covers the wind conditions highlighted in
Table 1
.
The 1:7 scale tank tests included variations in keel tilt, which changes the running trim of the hull in the sailing condition and thus affects the resistance. Six models, four of which were representative of hull forms from other designers working in the Volvo/IMOCA circuit, were tested in a 2 week period.
The problem of load sharing when sailing upwind between the canting keel, dagger-board, rudder and hull is complex, as illustrated in Figure 1. Whilst the lift from the canting keel produces a small sideforce compared to the dagger-board it produces a vertical force that offsets some of the boat’s displacement and this can be considerable at higher speeds when the dagger-board is raised.
The load sharing was investigated using a CFD panel code, which had the advantage over RANSE codes that it enabled calculations to be performed for a large number of configurations in a cost effective and timely manner. The calculations were, however, simplified by performing them at fixed speed and trim.
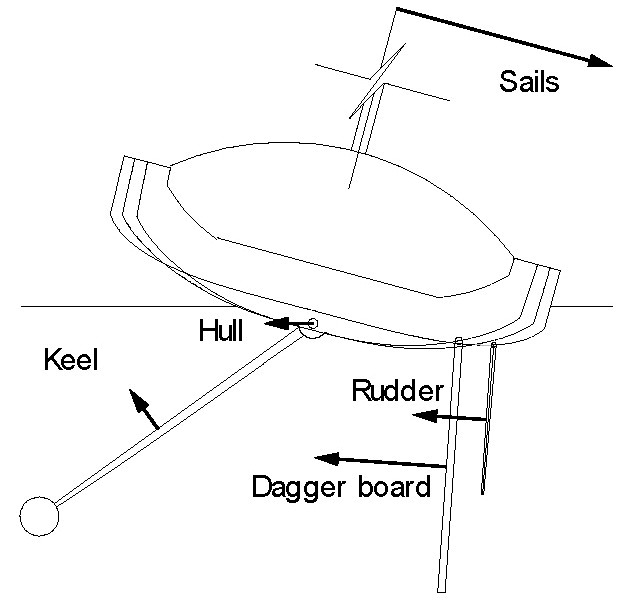
Figure 1 - Side force contributions
Tank tests were then performed at 1:3 scale using a hull selected from the 1:7 scale tests and fitted with a canting keel and dagger-board with an arrangement that allowed different keel tilt and board toe-in and tilt angles to be set. These tests were conducted over a 3 week period and were aimed at running the model in its sailing equilibrium condition, with the correct running trim, sailing sideforce and associated leeway for the water ballast configurations appropriate to each speed, ranging from 9 to 28 knots.
Finally the scaled data from the tank tests was used to refine the hydrodynamic model in the VPP for use when conducting the sailing trials on the new boat.
3. VPP CALCULATIONS
The normal VPP output is a polar diagram of boat speeds for a range of true wind speeds (TWS) and angles (TWA), as illustrated in
Table 1
, but underlying these speeds are the associated equilibrium hydrodynamic and aerodynamic forces and moments together with the optimised sail configurations. Important data for setting up tank tests or CFD calculations derive from the sail combinations, including masthead or fractional headsails and reef or twist settings that affect the centre of effort height. The water ballast condition affects the stability and combined with the associated sail combinations enable the sailing sideforce to be calculated. This is used in the tank tests to determine the equilibrium leeway angle.
Table 1 - Boat speeds for differential wind conditions
True wind speed - knots
Models were towed in the tank tests from close to the waterline (DWL) wheras the actual boat is driven by sails with a centre of effort approximately 405 of the sail height above DWL (at full hoist). This difference is compensated int he tank by applying trim moment using a ballast shift in the model to simulate the bow down trim from the thrust of the sails. The hydrodynamic drag increases significantly between upwind speeds of 11 knots and running speeds of 28 knots the resulting in large trim moments and it is important to simulate these correctly to ensure that the running trim of the model matches how the boat will actually sail, particularly when reefed downwind and/or flying masthead or fractional gennakers.
4. 1:7 SCALE TANK TESTS
The 1:7 scale tank tests were an efficient method for comparing hull forms but also provided some data on the effects of keel tilt.
The model canting keel was fitted with small conical turbulence stimulators that had been developed for testing of America’s Cup Class models, with drag coefficients derived from low Reynolds number wind tunnel tests. The test arrangements and model sizes had been used successfully for numerous previous racing yacht programmes.
It can be seen from Figure 2 that in the reaching The reduction of leeway with keel tilt could therefore be the cause of reported high speed control problems.
The effect of keel tilt on performance is related to the resistance, as shown in Figure 3, and this is plotted against the square of sideforce, which produces linear trends through the data due to the linear relationship of induced drag with the square of lift. There was a considerable reduction in resistance with keel tilt and, as with leeway, the resistance must be compared at constant values of sideforce for sailing equilibrium.
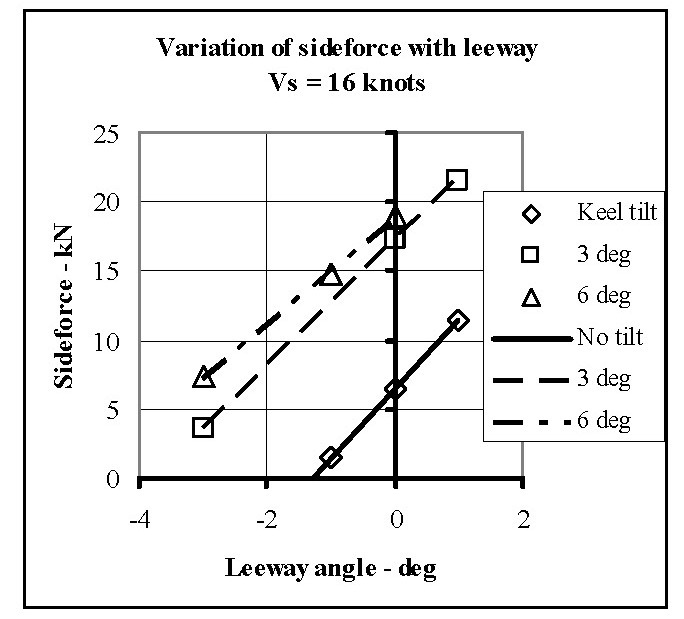
Figure 2 - Variation of side force with leeway
the sideforce required to achieve equilibrium when sailing depends on the stability of the boat and the centre of effort height of the sails. So, data from the different keel tilt angles must be compared at constant sideforce values. It can be seen from Figure 2 that it is possible, for example at a sideforce of 10 kN, that the yacht may sail with a negative leeway angle when the keel is tilted.
The hull develops some sideforce when heeled and yawed but more significantly it develops a considerable yaw moment, the so called Munk moment. The yacht is held on course by the rudders but steering problems can arise if the Munk moment switches direction from positive to negative as the leeway becomes negative. The reduction of leeway with keel tilt could therefore be a cause of reported high speed control problems on other Open 60s.
The effect of keel tilt on performance is related to the resistance, as shown in Figure 3, and this is plotted against the square of sideforce, which produces linear trends through the data due to the linear relationship of induced drag with the squatre of lift. There was a considerable reduction in resistance with keel tilt and, as with leeway, the resistance must be compared at constant values of sideforce for sailing equilibrium.
Figure 3 - Variation of resistance with side force ^2
The causes for the reduction in resistance are complex and are related to the semi-displacement characteristics of the hull at speeds of 16 knots and higher. These characteristics are illustrated in Figure 4, which shows the variation of sideforce with the running trim angle of the model.
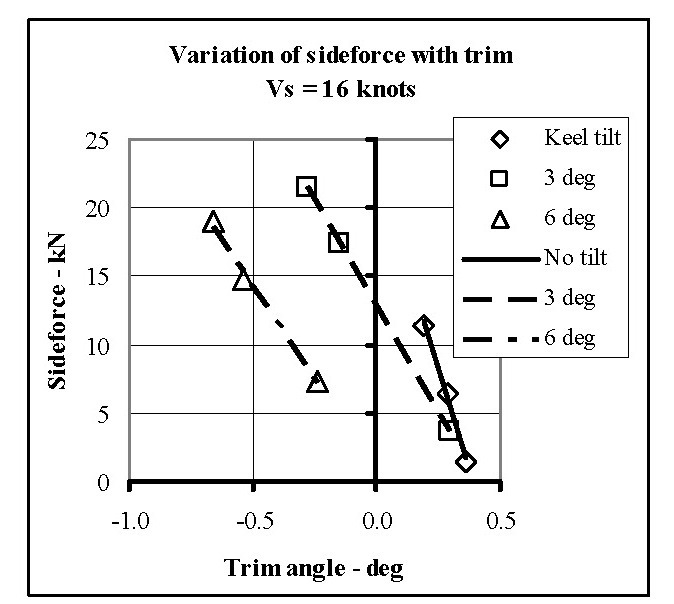
Figure 4 - Variation of side force with trim angle
Comparing the data again at constant sideforce values it can be seen that the trim angle decreases with increasing keel tilt and beomes negative or bow down.
This the 1:7 scale tests revealed the potential for the lowering of resistance by increasing the keel tilt but with the risk of running the hull at negative leeway and negative trim angles. This could potentially cause problems at higher speeds above 16 knots, with more bow down trim because of the greater potential of switching of the Munk moment.
Further investigations were required into the effect of keel tilt when sailing upwind at lower speeds with the daggerboard deployed.
5. CFD CALCULATIONS
To investigate the upwind performance of a tilted keel with dagger-boards and as a precursor to further tank tests a CFD Model was set up. This was created from a 3D igs file of the hull and appendages, which included straight and curved dagger-boards, as illustrated in Figure 5. The dagger-boards were cambered so were asymmetric with handed port and starboard boards. Thus the dagger-boards would produce side force with the hull operating at zero leeway and without any toe-in angle.
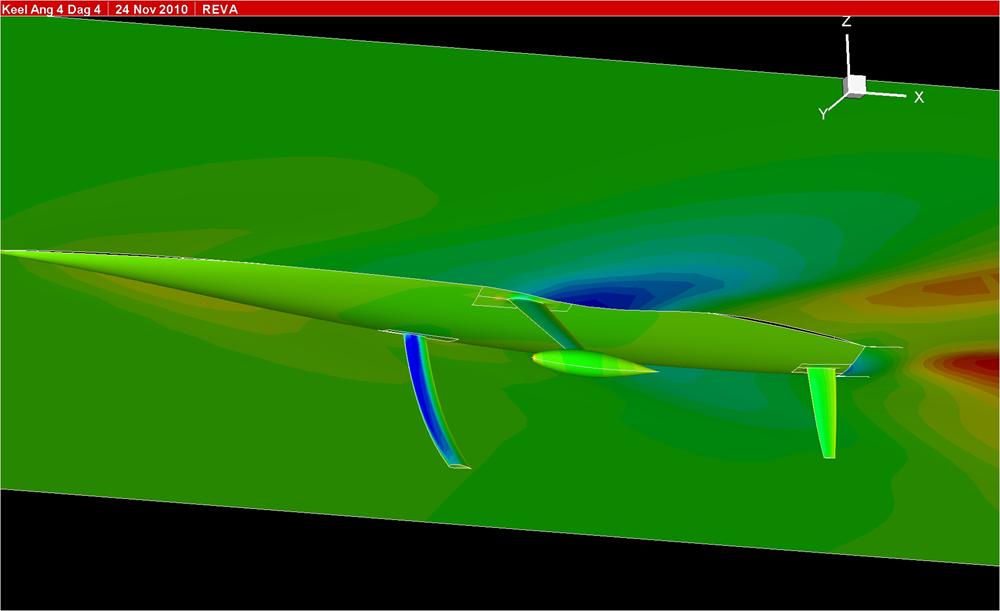
Figure 5 - CFD model
The raw data obtained from the panel code at the three different sinkages, with fixed trim, were interpolated to find the results at the desired displacements. The results were then further interpolated for three set values of total sideforce appropiate for the upwind sailing condition, with the force applied at a distance from the bow to represent the balance with the rig forces. That is at a fixed value for the yaw moment.
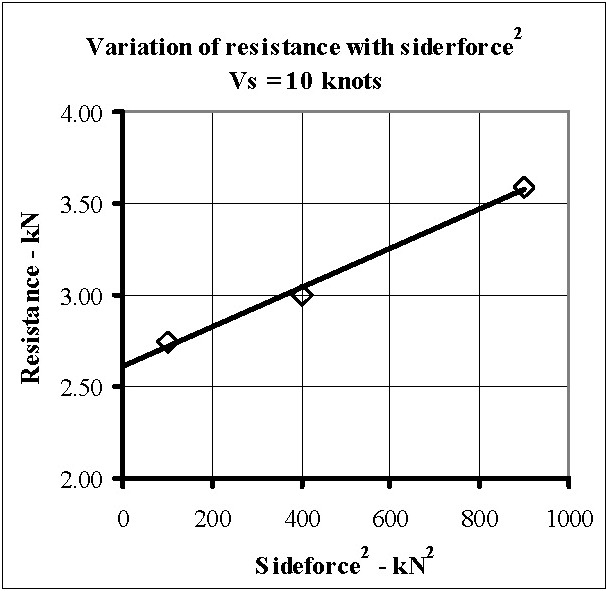
Figure 6 - Resistance from CFD calculations
Resistance values from the set sideforce for one appendage configuration are shown plotted in figure 6 against the square of the sideforce. It can be seen that, just as with the tank data shown in Figure 3. This produces a linear trend.
Force and moment values for each indivdual appendage and the hull were tabulated for variations in keel tilt and daggerboard toe-in angles at two different dispalcements. Also calculated were the leeway angle associated with the sideforce and drag. An example is shown in Figure 7.
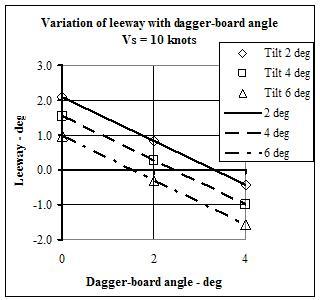
Figure 7 - Variation of leeway with toe in angle
It can be seen that the leeway angle decreased as the toe-in angle of the daggerboard was increased and became negative at higher toe-in angles. Increasing the keel tilt also reduced the leeway angle and caused it to become negative. In effect the angle of attack of the flow over the keel and daggerboard was determined by the fixed sideforce value that was required and this set the hull leeway.
The interesting data related to performance was the variation in resistance with keel tilt and daggerboard toe-in and an example is shown in Figure 8. The resistance ratios are compared to a base condition of 2 degrees keel tilt with 0 degrees daggerboard toe-in angle and it can be seen that increasing the daggerboard toe-in reduced the drag for all the keel tilt angles, but was particularly required for the highest keel tilt of 6 degrees.
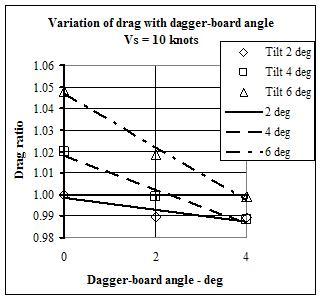
Figure 8 - Variation of drag with toe in angle
The upwind resistance variations with the daggerboard were considerably smaller than those obtained from the 1:7 scale tank tests without the daggerboard for the reaching condition. Care was needed to be exercised however because the CFD calculations were conducted free to trim and, as shown in Figure 4, the trim changes with the keel tilt were significant at 16 knots and will have affected the resistance.
CFD calculations gave the contributions of the individual appendages to the total forces and an example of the side force components with the keel tilt angle at 2 degrees is shown in Figure 9. It can be sen that approximately 80% of the side force was produced by the daggerboard and when the daggerboard toe-in angle was increased to 4 degrees the keel and rudder produced negative sideforce in order to achieve the required total equilibrium side force. This is considered to be a bad setting because the appendages are working in opposition rather than load sharing. The hull and bulb contributed approximately 8% to the side force and this only varied slightly with daggerboard angles.
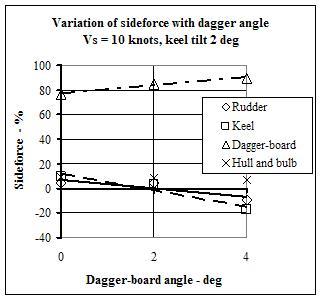
Figure 9 - Variation of side force components with toe in
The CFD results confirmed sailing experience on the benefit of increasing the dagger-board toe-in angle, particularly with the higher keel tilt angle and provided the basis for setting the matrix of test configurations for the 1:3 scale tank tests.
There were also variations in the heeling moment associated with the dagger-board toe in and keel tilt which were included in the performance analysis.
6. 1:3 TANK TESTS
The tests were conducted in the CEHIPAR Calm Water Towing Tank at El Pardo Madrid. This tank is 320 m long, 12.5 m wide, and 6.5 m deep and the towing carriage operated at speeds up to 10 m/s. The model was mounted from the carriage using the Wolfson Unit’s 3post dynamometer as shown in Figure 10. This had previously been used for testing 1:3 scale America’s Cup Class yacht models of 24t displacement but was light enough to enable the light 9t displacement of an IMOCA60 hull to be towed yet had suitable load ranges for the high speed runs.
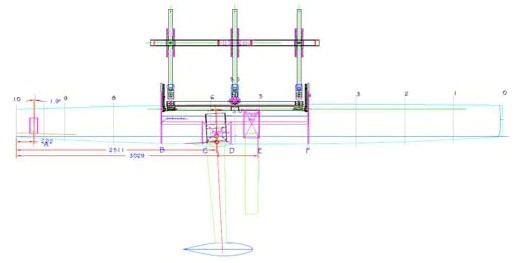
Figure 10 - Model with dynamometer
The tank length enabled tests to be conducted at three upwind speeds or two reaching speeds within one run but the high speed running condition require the full length of the tank. This enabled good productivity from the tests
Tests were conducted with the model in three conditions:
Table 2- Model test conditions
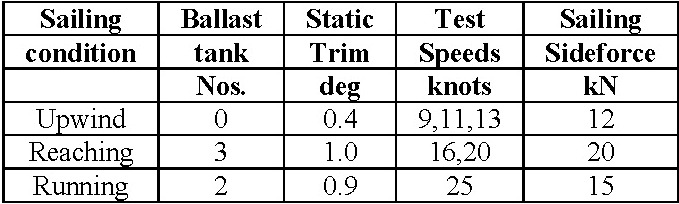
The increased static bow up trim with water ballast tanks filled was important since it helped offset the bow down trim from the sail thrust at higher speeds. A lower centre of effort height was used for the reaching and running conditions based on the study of sail combinations that would be used in these conditions.
The sailing sideforce results from the equilibrium between the roll stability of the yacht, with its keel canted and appropriate ballast condition, and the heeling moment from the couple between the sail force and the hydrodynamic force, which is largely produced by the keel, rudder and dagger-boards. It is important in determining the sailing leeway, which varies with speed.
An associated important visual aspect of the tests was 3 observations of the spray position from the bow and whether the stem was immersed. Control problems could arise with the stem immersed but the drag could increase with the spray root further back along the profile and the stem in the air, with an optimum shown in Figure 11.
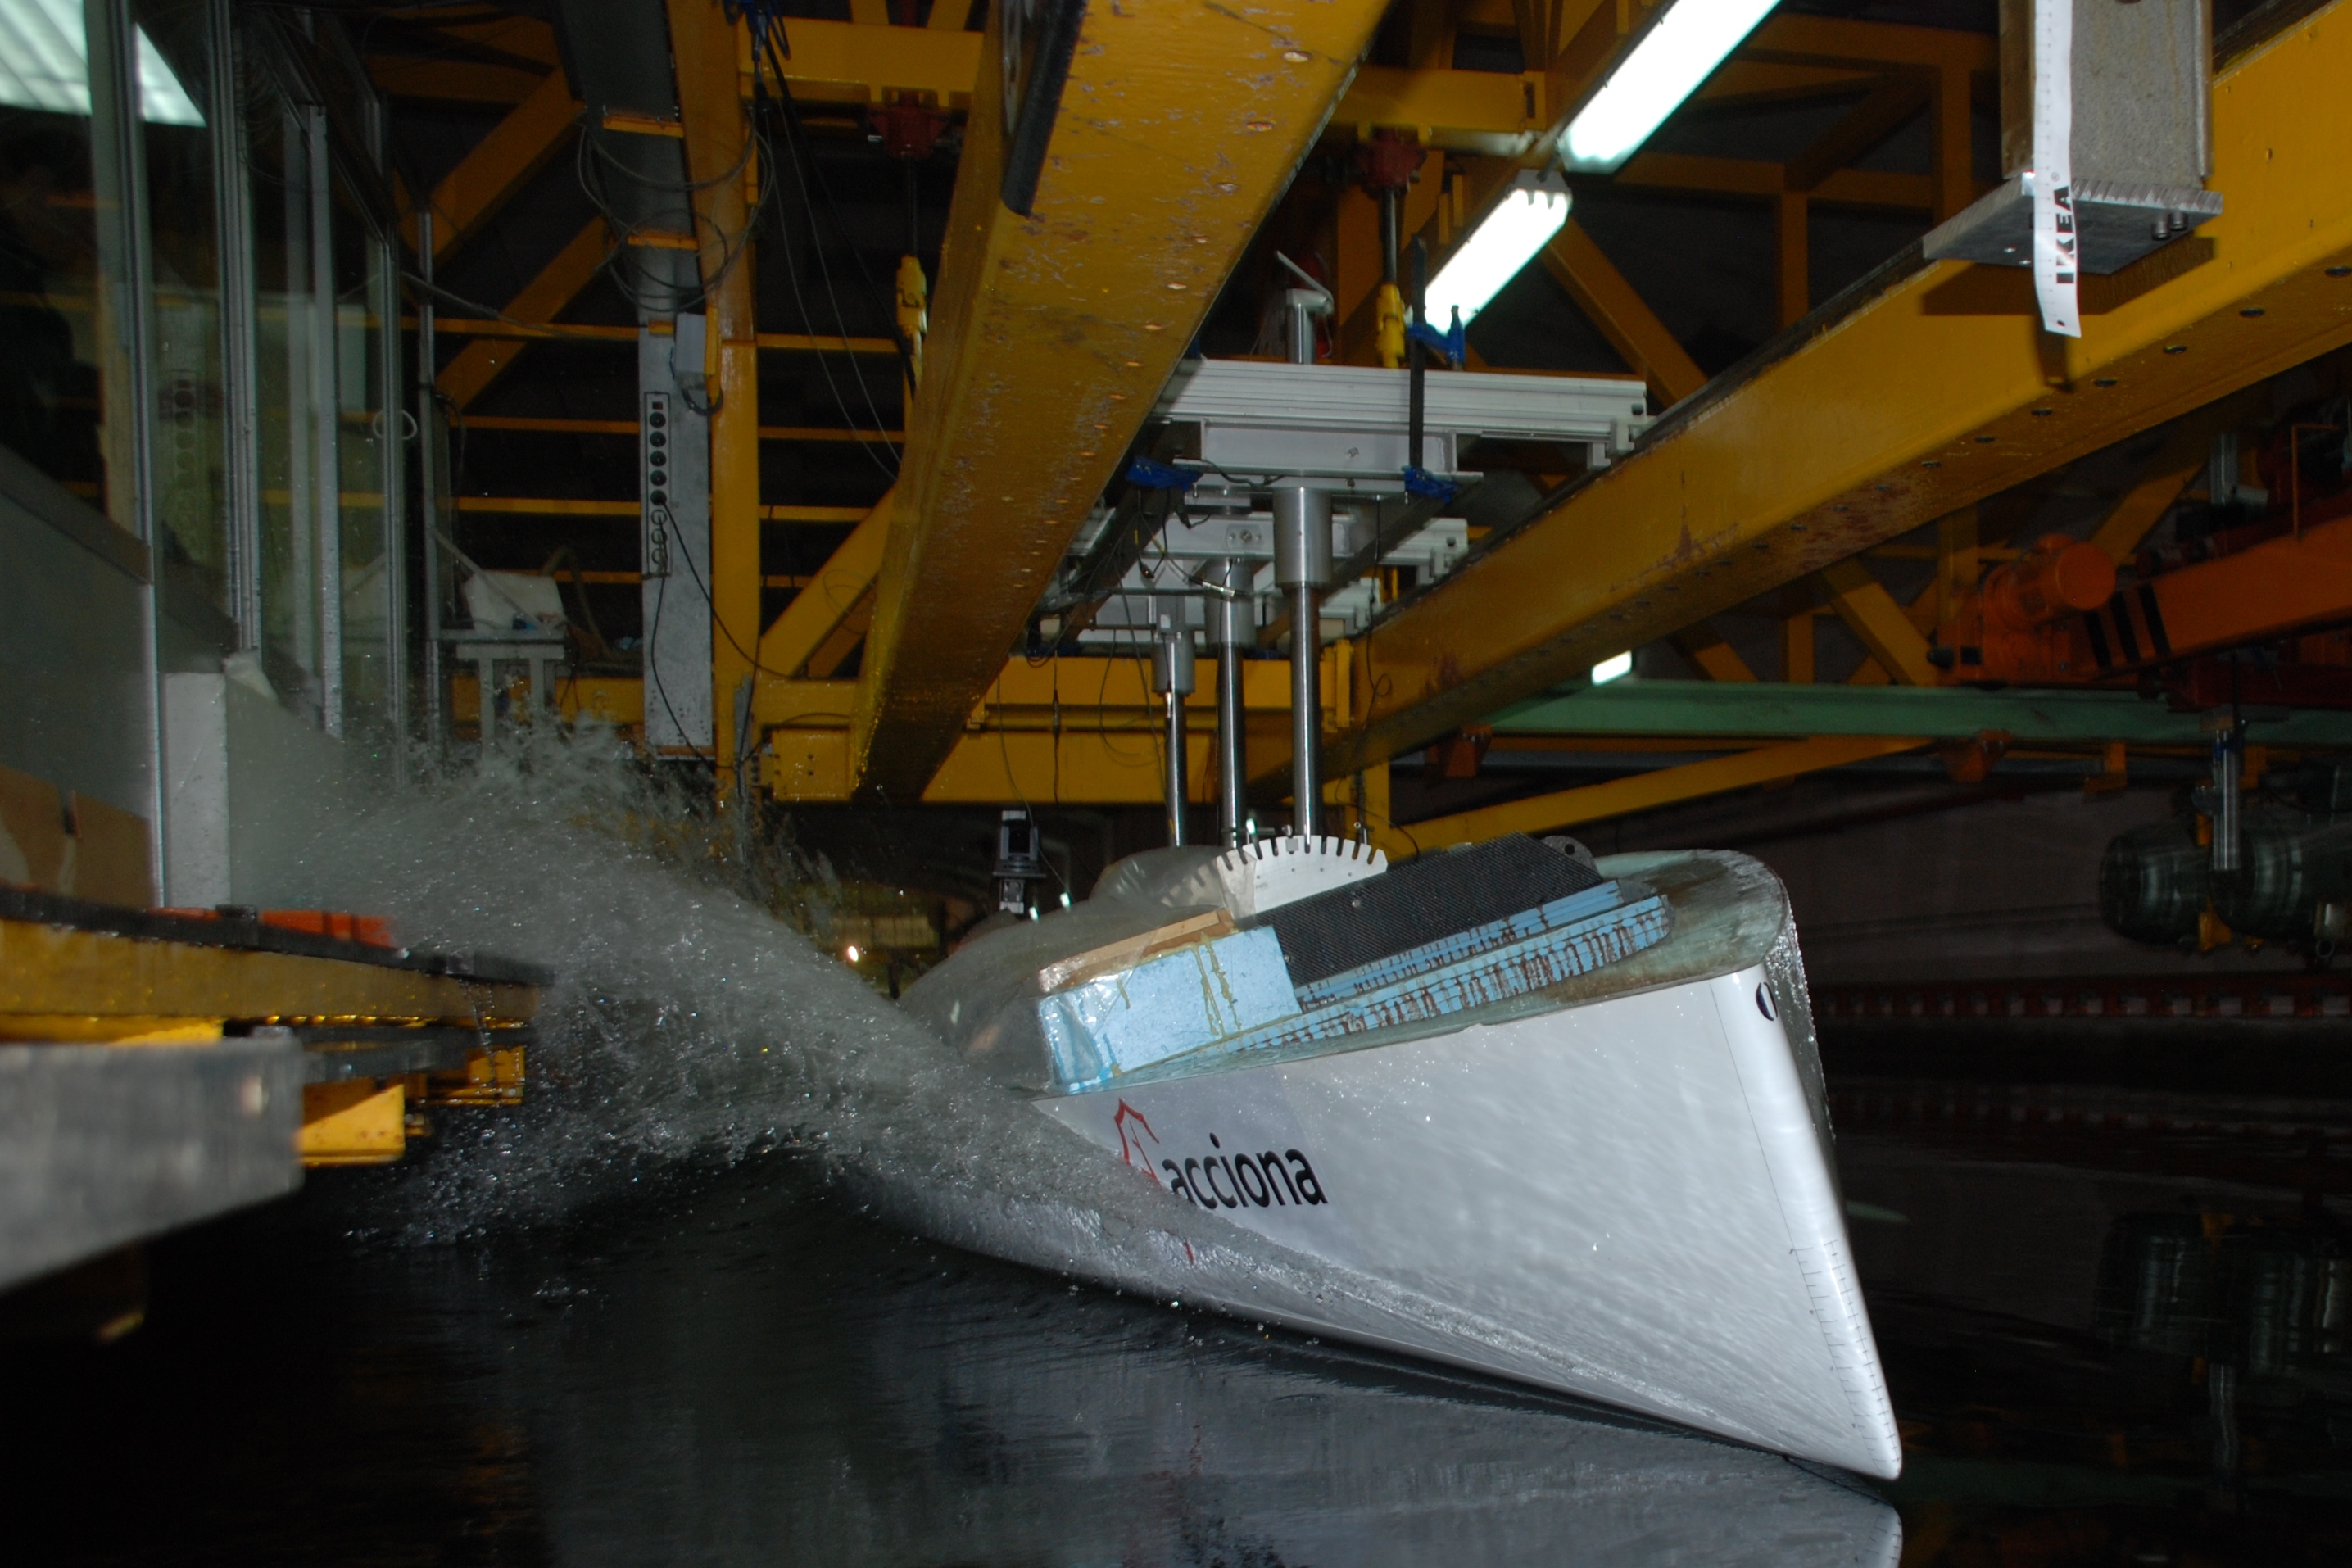
Figure 11 1.3 scale model 26 kts
The IMOCA60 yachts present interesting challenges to designers and sailors because of the wide range of speeds at which they can sail, as indicated in the VPP output shown in
Table 1
, with high speeds available due to the yachts’ light displacement and the trans-ocean race courses. Therefore appendages cannot be optimised solely for upwind sailing, particularly if they could cause control problems when running at high speeds with the keel canted.
The CEHIPAR tank was well suited for testing the 1:3 scale model over the full range of speeds and ballast conditions, at least in calm water.
Tests were conducted at two or three different leeway angles to enable the resistance to be interpolated at the sailing sideforce and the resistance data was plotted as shown in Figure 12. This figure contains data from upwind configurations with the same curved dagger-board set with 4 degrees toe-in and tested with two different keel tilt angles of 3 and 5 degrees.
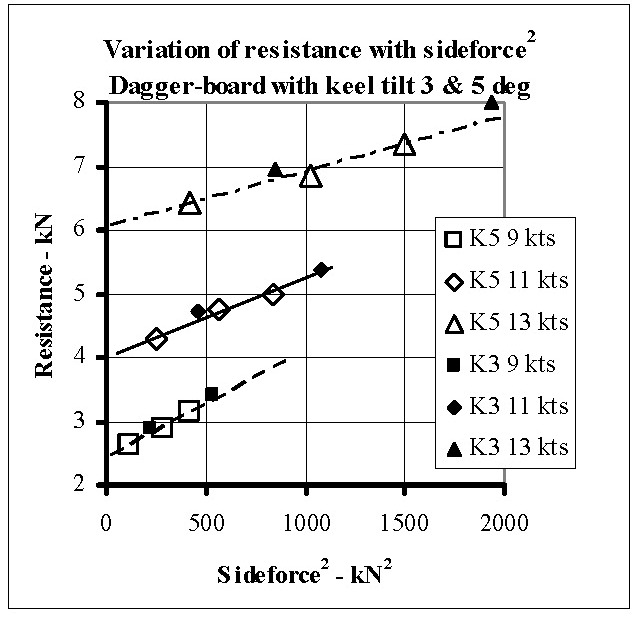
Figure 12 - Variation of resistance for different keel tilts
The speed was stepped up in the run down the tank enabling three speeds of 9, 11 and 13 knots to be tested at a fixed leeway. This resulted in the increase in sideforce with speed and associated increased values of resistance. Whilst it is an efficient means of testing it results in a group of data at lower sideforce values for the lower speeds and a higher group of values for the higher speeds, however the resistance values can be interpolated from both groups of data for the sailing sideforce, which is constant for all speeds, as given in
Table 2
.
The change in keel tilt from 3 to 5 degrees produced relatively small differences in resistance compared to the differences at higher reaching speeds, as found from the
1:7 scale tests shown in Figure 3. These small differences were, however, consistent with the CFD results, as shown in Figure 8.
The cross-over boat speed where the dagger-boards can be raised was investigated by testing at 14 and 15 knots with and without the dagger-board with the results shown in Figure 13.
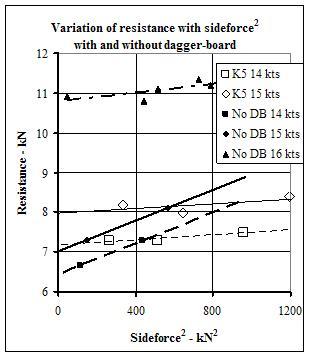
Figure 13 - Variation of resistance with side force ^2
The increased wetted area of the dagger-board added form drag, represented by an increase in drag at zero sideforce but reduced the induced drag, represented by a lower slope in the linear fit through the data. The crossover between the bold lines without the dagger-boards and the feint lines with represents equal drag but occurred at higher sideforce values with increasing speed. When the cross-over sideforce was greater than the sailing sideforce the performance would benefit from the lower drag without the dagger-board.
Results are also included in Figure 13 from tests at 16 knots without the dagger-board. The resistance is significantly higher than at 15 knots but this is partly due to the higher displacement from the ballast condition shown in Table 2. The slope of the linear fit through the data is, however, significantly lower than at 15 knots, which represents the reduced induced drag at higher speeds. This can be partly attributed to the lower lift coefficient on the keel to produce the required sideforce. The yacht is also operating in a semi-displacement mode at 16 knots, with an associated Froude number of 0.61, and its trim angle increased by approximately 1 degree and it’s heeled asymmetric waterplane also contributed to the sideforce, although with the tilted keel angle the sailing sideforce was produced with close to zero leeway, similar to the result from the 1:7 scale tank tests shown in Figure 2.
The relative loading on the keel and dagger-board was monitored during the tank tests using strain gauges to measure the bending moments and typical results are shown in Figure 14.
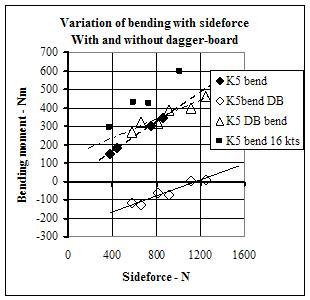
Figure 14 - Variation of keel bending moment with side force
The model scale bending moments from tests at 14, 15 and 16 knots are shown plotted against sideforce and linear trend lines have been fitted to the data. It can be seen that the data for 14 and 15 knots is distributed about a common line, although the leeway angles associated leeway angles differ. It can also be seen that the bending moment in the keel without the dagger-board is similar to the bending moment from the dagger-board with the keel, indicating that the keel generates the sideforce in the absence of a dagger-board. There were negative bending moments in the keel at lower values of sideforce with the dagger-board installed, which was similar to the CFD results shown in Figure 9.
The bending moments in the keel at 16 knots were significantly greater than at 14 and 15 knots and this is probably associated with the increased displacement and higher running trim angles referred to earlier.
The tank test data, at both 1:7 and 1:3 scale, indicated that there was a substantial drag reduction at 16 knots associated with increasing the keel tilt but there remained concern that the increased tilt would cause problems at high running speeds so tests were conducted at 24, 26 and 28 knots, with the associated ballast condition shown in Table 2. The resistance data is shown in Figure 15 and the reduction in resistance with increased keel tilt remains, with an interesting effect of a reduction in resistance with increasing sideforce instead of the usual increase due to induced drag. This reduction is probably associated with the planning properties of the hull.
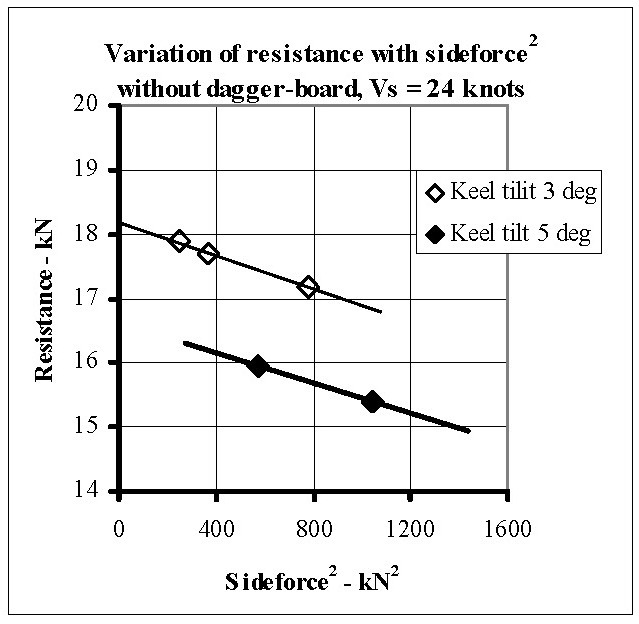
Figure 15 - Variation of resistance with keel tilt
The leeway angles associated with the sideforce are shown in Figure 16 and it can be seen that the angles are negative and become more negative at the higher tilt angle. This indicates that the angle of attack associated with the keel tilt at zero leeway results in more than the sailing sideforce so the leeway has to be reduced below zero to reduce the keel lift and sideforce. The negative leeway angles could cause control problems depending on the yaw balance between the hydrodynamic and aerodynamic forces.
Figure 16 - Variation of side force with leeway angle
The final piece of information regarding the effects of keel tilt regards the running trim of the hull, shown in Figure 17, and this is reduced to zero with the keel tilt at 5 degrees. The running trim of planing boats affects resistance, spray trajectory, directional stability and low trim can be unacceptable despite the appeal of low resistance.
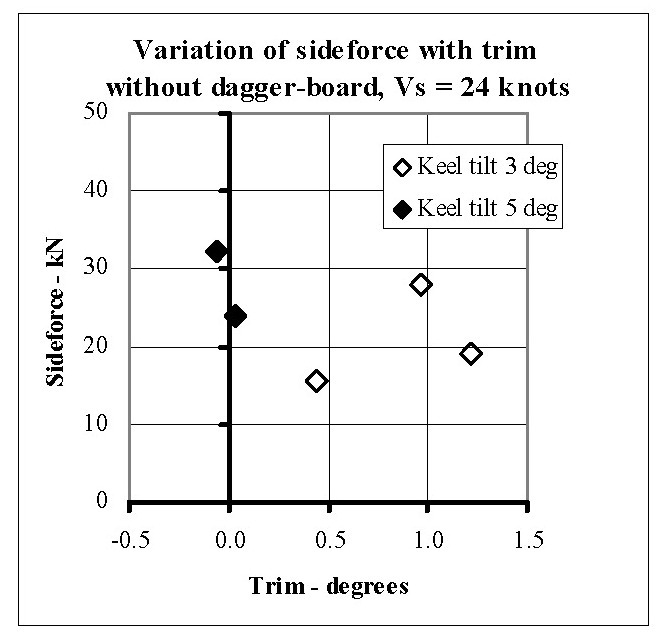
Figure 17 - Variation of trim with keel kilt
7. CONCLUSIONS
The combination of tank tests and CFD panel codes enabled a wide range of appendage test configurations to be investigated across a range of speeds from upwind to fast running.
The 1:7 scale tank tests were used to compare hulls but also provided information on the beneficial reduction in resistance at semi-displacement speeds due to tilting the fore and aft axis of the canting keel.
The CFD panel code calculations provided information on the relative loading of the keel and dagger-board for the upwind sailing condition with variations of toe-in angles and keel tilt, albeit at fixed trim.
The 1:3 scale tank tests produced similar results to the CFD calculations for the upwind keel and dagger-board combinations but extended the information to the high speed running condition and revealed that, with a high keel tilt angle, the yacht would sail with negative leeway angles and low running trim, potentially causing control problems.
Acknowledgements
The work in this paper was commissioned by Owen Clarke Design as part of their ongoing research and development programme into IMOCA60 design development and acknowledgement is given for their permission to publish. The authors thank colleagues from their respective organisations for assistance in conducting the work. Thanks are also given to the staff at CEHIPAR and ACCIONA for their assistance in conducting the 1:3 scale tests.
For more information on the design process go to:
Naval Architecture
RETURN TO: Home Page - Performance yacht design 101
To receive postings of future articles find and LIKE us at:

References
-
Claughton. A R & Oliver C (2004), “Design considerations for canting keel yachts”,
18th International HISWA Symposium on “Yacht Design and Yacht Construction”
, Amsterdam, 2004
-
Campbell, I., Robinson, J. & Brown, M (2002), “The accuracy and repeatability of tank testing from experience of ACC yacht development”,
High Performance Yacht Design Conference
, Auckland, New Zealand, RINA, December 2002
-
G. Delhommeau (1993) “Wave resistance code REVA”,
Cours de la 19th WEGEMT School,
Ecole Centrale de Nantes, Septembre 1993.
-
G. Delhommeau (2002), “La simulation mécanique en hydrodynamique : application en ingénierie navale",
Chapitre 9, pp. 277-329, "CAO et simulation en mécanique"
, Editions Hermès, Lavoisier, 2002, ISBN 2-7462-0340-5.
-
Maes F. (2006), “An experimental study of the hydrodynamics of a yacht with a canting keel and forward rudder”,
19th International HISWA Symposium on “Yacht Design and Yacht Construction”,
Amsterdam, 2006.
|