RETURN TO: Home Page - Performance Yacht Design 101
Innov’ Sail Conference, Lorient, 26-28 June, 2013
The IMOCA 60 class has a complicated set of foils: with canting and tilted keels, asymetric daggerboards that can be designed to be fitted to the hull in different orientations along with toed-in and twin / two rudder design that can also be configured in different orientations. Curved dagger-boards and straight boards with positive lift inducing dihedral angles have been used in number of recent IMOCA 60 designs and in other classes, principally multi-hulls. These were considered an option by the client for their new Open 60 design and so a research and development programme was instigated by Owen Clarke Design to compare new curved designs with conventional straight dagger-boards optimised for upwind conditions. It was felt that the modelling of the trim of the yacht was very important to the calculation and sharing of loads between all of the appendages, and so our group chose to use a combination of one third scale high speed towing tanks tests and computational fluid dynamics (CFD), rather than CFD alone to investigate the relative performance between these dagger-board types.
Nomenclature
λ , Leeway angle (degrees)
TWA, True wind angle (degrees)
TWS, True wind speed (knots)
1. INTRODUCTION
There has been a good deal of discussion in recent years regarding the pros and cons of curved verses straight dagger-boards in the IMOCA 60 class. It was natural then that as part of the design package for Owen Clarke’s latest Open 60 that a proportion of budget and time should be set aside to evaluate the relative performances of straight verses curves boards and to build on the previous test and CFD work that had already been undertaken by the group on various board configurations, angles and placement. This evaluation was undertaken as part of a wider study into Open 60 performance looking at the sharing of loads, affects of trim and various appendage designs and built on the one third scale testing undertaken for Ecover 3 in 2006.
Before concentrating on dagger-board selection it’s important to have an overview of the factors affecting the appendage design, the forces involved and why the experimental methods used were selected. Owen Clarke’s current IMOCA60 design.
Acciona
started with the known performance of their seven previous designs, including
Gamesa (ex Ecover 3),
compared to that of more recent Open 60’s from other designers. One of the parameters that had changed in recent IMOCA60 designs, including
Ecover 3
and her sister-ship
Aviva
, is increasing fore and aft inclination of the canting keel pivot axis to DWL, or as it is sometimes described; keel tilt. The interaction between the multiple appendages on these craft has always been complex and the introduction of tilt has added a further factor. Tilt refers to the fact that at the hull/keel intersection the forward pivot bearing is placed higher than the aft. The result is that when the keel is canted the fin takes on a positive angle of attack, inducing lift, reducing righting moment, altering hull trim, rudder loading and changes the proportion of load sharing with the dagger-board when it is deployed. This was subject to the previous paper by the authors.
This change of trim induced by the keel foil can itself be altered by varying the size, angles and placement of the dagger-boards as well as by boat speed and sail selection. Sail selection and reefing has a significant effect on the sail force trimming moment, which itself has the affect of driving the bow down and increasing rudder load/drag. If this were not complicated enough, Open 60’s are able (depending on true wind speed/true wind angle and sail selection) to adjust their fore and aft trim using up to between 5,000 and 6,000kg of water per side and they alter the selected balance not just based on wind, but also sail selection and sea state. In addition, when reefed, lower sail centers of effort and the addition of water ballast increase the side force required to be developed by the appendages and we will show why this is important in dagger-board selection and their angles to the yacht’s centerline and DWL.
There are therefore a considerable number of inter-related factors that contribute to a matrix of experimental conditions one may look to investigate. Deriving accurately the change in trim of the yacht caused by these factors and therefore the actual attack angles/lift and drag forces on each of the foils and then squaring the circle so that the resulting correct trim is derived for each equilibrium condition is a highly complex, crucial problem to solve.
While as a group we have great confidence in the ability of CFD to derive foil loadings we felt that a combination of the use of CFD and scale model testing was likely to provide the best overall understanding of the problem. Using CFD in parallel with model testing would also provide us with data that we could compare and so we would not be reliant wholly on one source of information that might lead us up a blind alley and/or to false conclusions. The design team required greater confidence in any analysis than it was felt reliance on a single methodology (especially one without a long history of use in this boat type) could provide. The crux of the matter being that this was not an academic exercise, their recommendations would be acted upon by the client; months of work would be undertaken, many millions of Euros spent and ultimately one sailor would have to deal with the results.
There was already anecdotal information from some of Owen Clarke’s competitor’s yachts that indicated; whilst increasing keel tilt improved reaching performance at say 16 knots, excessive tilt could lead to control problems when sailing downwind at higher speeds and while there was a requirement to improve performance this was not come at the cost of control or sea-keeping in difficult conditions.
2. DAGGER-BOARD SAILING CONDITIONS
The dagger-boards are used to generate sideforce efficiently with low induced drag. It will be seen later that the tank tests reveal the cross-over speed is somewhere above 13 knots, where it becomes effective to raise the dagger-boards because the hull and canting keel can produce sideforce with a net drag saving by eliminating the profile drag of the dagger-boards.
In the Vendee Globe race average speeds are:
11.4 knots with a Vendee record of 11.7 knots in the Atlantic heading south with the wind predominantly aft the beam.
11 knots in the Atlantic heading north with the wind predominantly forward of the beam.
12.5 knots in a straight line in the Southern Ocean with the Vendee record of 12.7 knots for the Pacific but actually a little below 15 knots over the ground.
Previous experience: computer modelling, tank testing and on the water in two boat testing had shown that the speeds of interest for dagger-board development are in the displacement and semi-displacement speed range for the yacht of 9 to 13 knots (Froude numbers of 0.35 to 0.50). In the higher speeds of 15 knots, sailing down the Atlantic and in the Southern Ocean, the dagger-boards tend to be raised. However, to be sure of this we would include in our test Matrix runs at higher speeds with curved daggerboards deployed, in order to test this hypothesis.
For an Open 60, any vertical force generated by the canting keel or by a curved dagger-board has to benefit the yacht by reducing the drag of the hull in relatively slow conditions and not where light displacements yachts such as the AC72 catamarans or International Moth dinghies can become fully foil borne.
3. DESIGN TOOLS
VPP calculations, based on hydrodynamic data from previous tank tests, were performed and some adjustments made to match the performance to that of
Ecover 3
. This tricky job was performed using the WinDesign VPP with customised features to match the canting keel effects on stability and different flotations to match the various water ballast configurations for the boat.
Detailed output from the VPP was used to provide input to the tank tests and CFD calculation. While not directly relevant to the dagger-board design itself and prior to the appendage development phase, 1:7 scale model testing was undertaken over a two week period on the most promising candidate designs based on a range of representative hull forms from other designers working in the Volvo/IMOCA circuit.
The 1:7 scale tank tests were conducted up to a scale speed range of 7 to 20 knots using only the canting keel without dagger-boards to simplify the test setup whilst enabling differences in hull hydrodynamics to be evaluated. The test programme also included variations in keel tilt, which helped establish its benefits. Of the six models tested, three were short-listed and the final winning model (a development of the OCD genre) was then used both to build the 1:3 scale model and the parallel CFD studies.
The problem of load sharing when sailing upwind between the canting keel, dagger-board, rudder and hull is complex, as illustrated in Figure 1. Whilst the lift from the canting keel produces a smaller side force compared to the straight dagger-board, it produces a vertical force that offsets some of the boat’s displacement. This can be considerable at higher speeds when the dagger-board is raised.
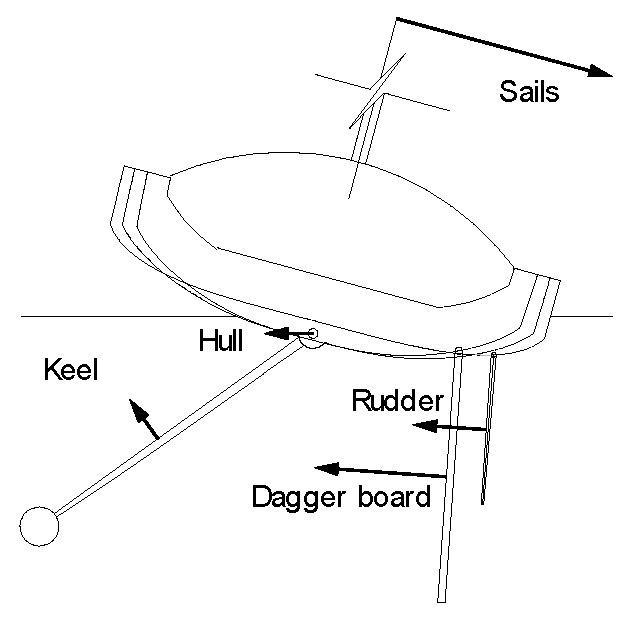
Figure 1 – Side force contributions
Setting the ratio of the side force developed by the dagger-board to that by the keel is a crucial factor in optimising the performance of the boat in any mode when the dagger-board is in use. Introducing curvature into the dagger-board results in it also producing some vertical force to complement that from the keel at lower speeds.
The load sharing and associated variations in induced drag was investigated using a CFD panel code, which had the advantage over RANS codes that it enabled calculations to be performed for a large number of configurations in a cost effective and timely manner. The calculations over an extensive test matrix were simplified by performing them at fixed speed and trim.
The CFD work undertaken over several months resulted in a selection of appendages which were then narrowed down to a select number which were then built for the 1:3 scale tests. As importantly using the results from this stage of the work we were able to narrow down the test matrix somewhat, discounting some areas and thereby saving time in the tank that could be dedicated to other work.
The canting keel has to be a symmetrical section to operate on both tacks but the dagger-boards are asymmetric so can be a cambered section to minimise their viscous drag. The two dimensional code MSES was used to develop the dagger-board sections used throughout the work. The sections used early on in the preparatory work were developments of those already used on
Ecover 3
and
Aviva
. At the point where candidate boards had been developed for the 1:3 scale testing Giorgio Provinciali developed sections that were optimised around the predicted lift forces which we were expecting the boards to produce, based on the predicted load sharing with the keel. Using MSES, a small adjustment to the final section used on
Acciona
was made, post scale model testing, once the final load sharing and board type selection had been made.
Model tests were performed at 1:3 scale using a hull selected from the 1:7 scale tests and fitted with a canting keel and dagger-boards with an arrangement that allowed different keel tilt and board toe-in and board tilt angles to be set. These tests were conducted over a 3 week period and were aimed at running the model in its sailing equilibrium condition, with the correct running trim, sailing side force, sail force trimming moment and associated leeway for the water ballast configurations appropriate to each speed, ranging from 9 to 28 knots.
Finally the scaled data from the tank tests was used to refine the hydrodynamic model in the VPP for use when conducting the sailing trials on the new boat.
4. VPP CALCULATIONS
The normal VPP output is a polar diagram of boat speeds for a range of true wind speeds (TWS) and angles (TWA), as illustrated in Table 1, but underlying these speeds are the associated equilibrium hydrodynamic and aerodynamic forces and moments together with the optimised sail configurations. Important data for setting up tank tests or CFD calculations derive from the sail combinations, including masthead or fractional headsails and reef or twist settings that affect the centre of effort height. The water ballast condition affects the stability and combined with the associated sail combinations enable the sailing side force to be calculated. This is used in the tank tests to determine the equilibrium leeway angle.
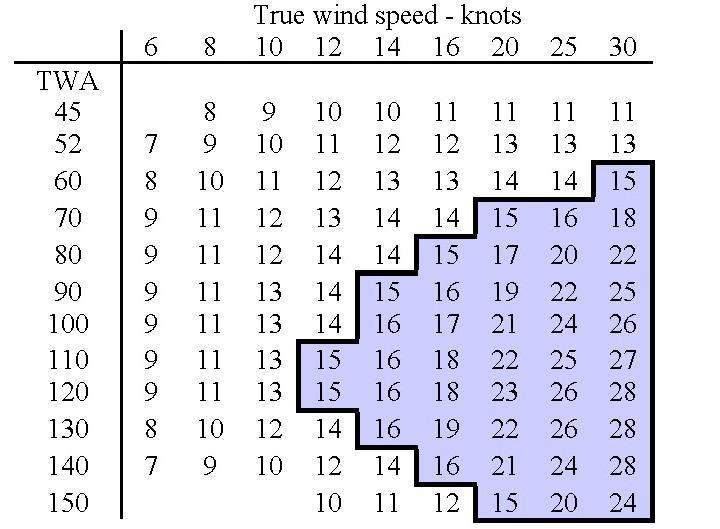
Table 1 – Boat speeds for different wind conditions
Models were towed in the tank tests from close to the waterline (DWL) whereas the actual boat is driven by sails with a centre of effort approximately 40% of the sail height above DWL. This difference is compensated in the tank by applying trim moment using a ballast shift in the model to simulate the bow down trim from the thrust of the sails. The hydrodynamic drag increases significantly between upwind speeds of 11 knots and running speeds of 28 knots the resulting in large trim moments and it is important to simulate these correctly to ensure that the running trim of the model matches how the boat will actually sail, particularly when reefed downwind and/or flying masthead or fractional gennaker.
It can also be seen from the VPP calculations that the sailing conditions where dagger-boards will be deployed, at boat speeds of less than 15 knots, are with true wind angles below 90 degrees and true wind speeds up to 16 knots.
5. CFD CALCULATIONS
To investigate the upwind performance of a tilted keel with dagger-boards and as a precursor to further tank tests a CFD model was set up. This was created from a 3D Iges file of the hull and appendages, which included straight and curved dagger-boards. Prior to the 1:7 scale hull model testing, all CFD was carried out using straight boards with differing dihedral angles and angles to the centreline in order to develop an initial understanding of the relative trade off between the vertical lift force and induced drag. The dihedral angles ranged either side of vertical, as shown in Figure 2, with the positive angle boards acting in the same manner and creating vertical lift equivalent to those of curved boards.
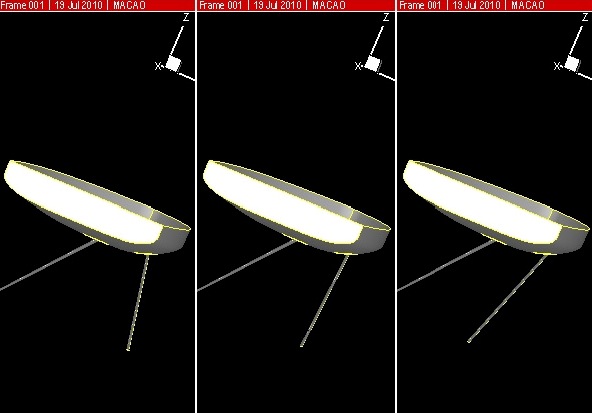
Figure 2 – CFD model with straight dagger-board
All dagger-boards were cambered and so were asymmetric with handed port and starboard boards. Thus the dagger-boards would produce side force with the hull operating at zero leeway and without any toe-in angle.
The computed drag differences at sailing sideforce were generally less than 1% for an increase in vertical force of up to 3% of the displacement of the yacht. These variations due to dihedral were small enough to tank test the straight dagger-board at just one dihedral angle for comparison with the curved dagger-board.
For later work, creating the foils to be used in 1:3 scale testing, curved boards were developed, as represented in Figure 3, that would more closely model the pressure field between the hull and foil. This was considered to be an advantage that the curved foil has compared to a straight foil with a large positive dihedral angle.
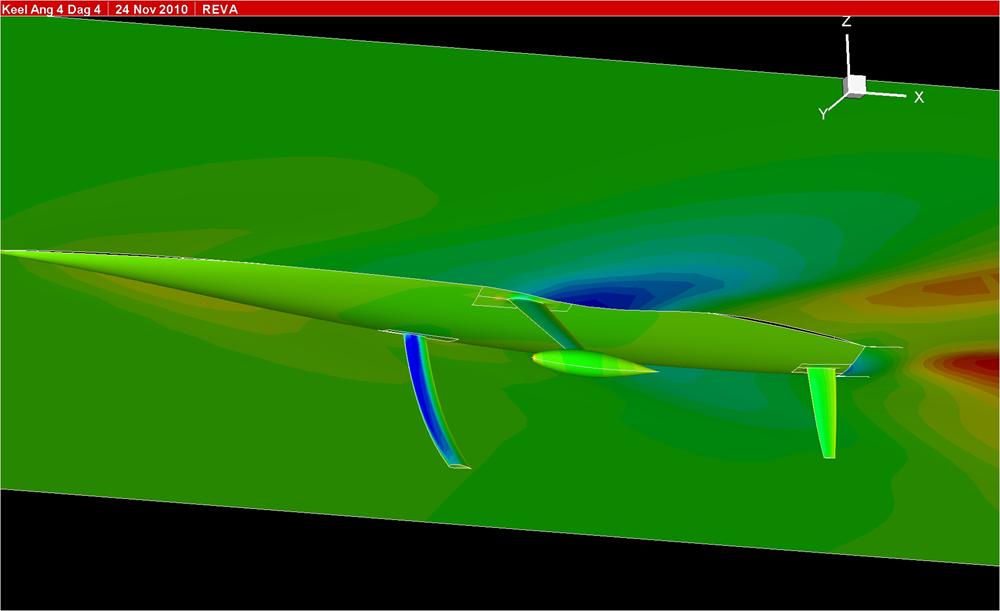
Figure 3 – CFD model with curved dagger-board
The raw data obtained from the panel code at the three different sinkages, with fixed trim, were interpolated to find the results at the desired displacements. The results were then further interpolated for three set values of total side force appropriate for the upwind sailing condition, with the force applied at a distance from the bow to represent the balance with the rig forces, i.e. at a fixed value for the yaw Moment.
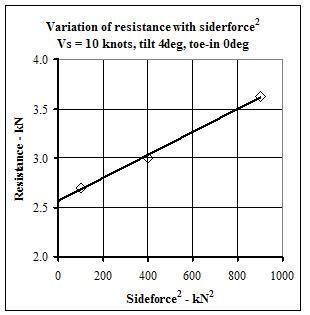
Figure 4 – Resistance from CFD calculations
Resistance values from the set side force for one appendage configuration are shown plotted in Figure 4 against the square of side force. It can be seen that, just as with the tank data shown in Figure 11, this produces a linear trend.
Force and moment values for each individual appendage and the hull were tabulated for variations in keel tilt and dagger-board toe-in angles at two different displacements. Also calculated were the leeway angle associated with the side force and drag, an example is shown in Figure 5.
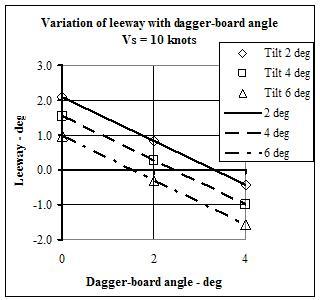
Figure 5 – Variation of leeway with toe in angle
It can be seen that the leeway angle decreased as the toe-in angle of the dagger-board was increased and became negative at higher toe-in angles. Increasing the keel tilt also reduced the leeway angle and caused it to become negative. In effect the angle of attack of the flow over the keel and dagger-board was determined by the fixed side force value that was required and this set the hull leeway.
The interesting data related to performance was the variation in resistance with keel tilt and dagger-board toe-in and an example is shown in Figure 6. The resistance ratios are compared to a base condition of 2 degrees keel tilts with 0 degrees dagger-board toe-in angle. It can be seen that increasing the dagger-board toe-in deduced the drag for all keel tilt angles but was required particularly for the highest keel tilt of 6 degrees.
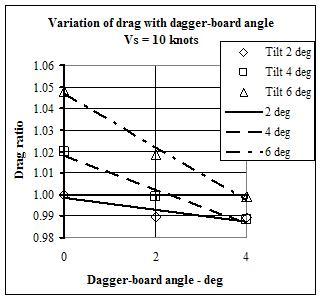
Figure 6 – Variation of drag with toe-in angle
The upwind resistance variations due to keel tilt with the dagger-board were considerably smaller than those due to keel tilt obtained from the 1:7 scale tank tests without the dagger-board for the reaching condition. Care, however, needed to be exercised because the CFD calculations were run with fixed trim whereas the tank tests were conducted free to trim and the trim changes with keel tilt were significant at 16 knots and will have affected the resistance.
CFD calculations gave the contributions of the individual appendages to the total forces and an example of the side force components with the keel tilt angle at 2 degrees is shown in Figure 7. It can be seen that approximately 80% of the side force was produced by the dagger-board and when the dagger-board toe-in angle was increased to 4 degrees the keel and rudder produced negative side force in order to achieve the required total equilibrium side force. This is considered to be a bad setting because the appendages are working in opposition rather than load sharing. The hull and bulb contributed approximately 8% of the side force and this only varied slightly with dagger-board angles.
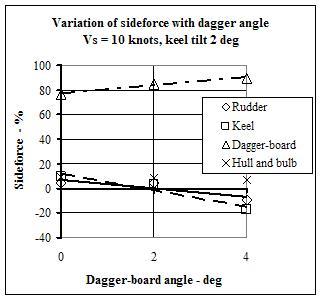
Figure 7 – Variation of side force components with toe-in
The CFD results also provided the vertical force produced by each appendage. An example is shown in Figure 8, with the vertical force expressed as a percentage of the displacement of the yacht. This illustrates two features:
The vertical forces increase linearly with sideforce. This is because both are related to the pressure distribution over the appendages. The sailing sideforce is, however, determined by the stability of the yacht and, as is shown in Table 2, this was 12kN for the upwind sailing condition where dagger-boards would be deployed.
The keel produced a small vertical force at the sailing sideforce and the curved dagger-board significantly more but only approximately 5% of the yacht’s displacement.
The horizontal projected area of the keel was considerably greater than that of the dagger-board and the ratio of vertical to sideforce was approximately 1.4 from the keel but only 0.5 from the dagger-board. The higher vertical force produced by the dagger-board is attributed to its greater share of the overall sideforce.
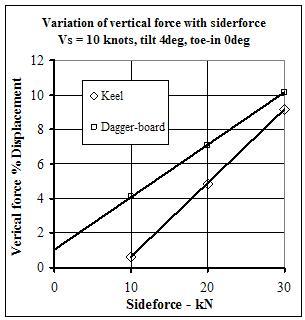
Figure 8 – Variation of vertical force with sideforce
The CFD results confirmed sailing experience of the benefit of increasing the dagger-board toe-in angle, particularly with the higher keel tilt angle and provided the basis for setting the matrix of test configurations for the 1:3 scale tank tests. There were also small variations in the heeling moment associated with the dagger-board toe in and keel tilt which were included in the performance analysis.
6. 1:3 TANK TESTS
The tests were conducted in the CEHIPAR Calm Water Towing Tank at El Pardo Madrid. This tank is 320 m long, 12.5 m wide, and 6.5 m deep and the towing carriage operated at speeds up to 10 m/s. The model was mounted from the carriage using the Wolfson Unit’s 3post dynamometer as shown in Figure 9. This had previously been used for testing 1:3 scale America’s Cup Class yacht models of 24t displacement but was light enough to enable the light 9t sailing displacement of an IMOCA 60 hull to be towed and had suitable load ranges for the high speed runs.
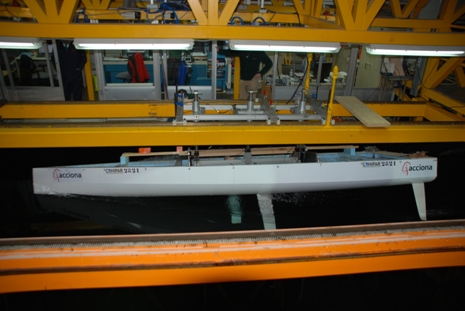
Figure 9 - Model with dynamometer
The tank length enabled tests to be conducted at three upwind speeds or two reaching speeds within one run but the high speed running condition require the full length of the tank. This enabled good productivity from the tests
Tests were conducted with the model in three conditions:
Table 2 - Model test conditions
Tests were conducted at two or three different leeway angles to enable the resistance to be interpolated at the sailing side force and the resistance data was plotted as shown in Figure 10. This figure contains data from upwind configurations with the same curved dagger-board set with 3 degrees keel tilt and tested with three different toe-in angles of 0, 2 and 4 degrees.
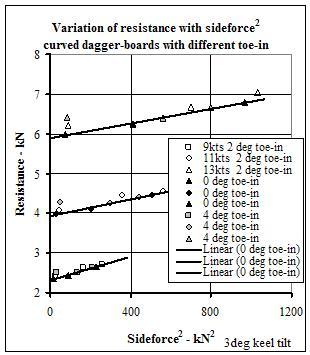
Figure 10 – Variation of resistance for different toe-in angles
The speed was stepped up in the run down the tank enabling three speeds of 9, 11 and 13 knots to be tested at a fixed leeway. This resulted in the increase in side force with speed and associated increased values of resistance. Whilst it is an efficient means of testing it results in a group of data at lower side force values for the lower speeds and a higher group of values for the higher speeds, however the resistance values can be interpolated from both groups of data for the sailing side force, which is constant for all speeds, as given in Table 2.
The change in toe-in angle produced relatively small differences in resistance, which was consistent with the CFD results. The resistance at the sailing sideforce was interpolated from the tests at different leeway angles to determine the best toe-in angle.
The effect of toe-in angle on the resistance of straight dagger-boards was less than on curved boards. Comparisons were made between the straight and curved dagger-boards, as shown in Figure 11. These were made across the speed range and for two different heel angles of 15 and 22.5 degrees.
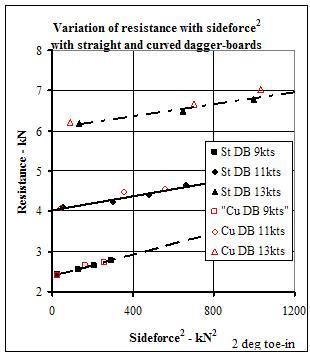
Figure 11 – Comparison between straight and curved dagger-boards
The cross-over boat speed where the curved dagger-boards can be raised was investigated by testing at 14 and 15 knots with and without the dagger-board with the results shown in Figure 12.
The increased wetted area of the dagger-board added form drag, represented by an increase in drag at zero side force but reduced the induced drag, represented by a lower slope in the linear fit through the data. The crossover between the bold lines without the dagger-boards and the feint lines with represents equal drag but occurred at higher side force values with increasing speed. When the cross-over side force was greater than the sailing side force the performance would benefit from the lower drag without the dagger-board.
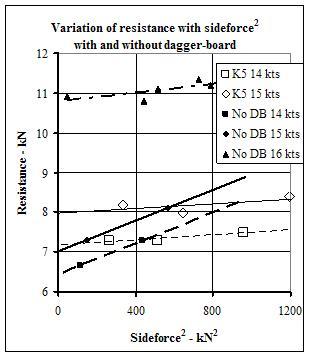
Figure 12 – Variation of resistance with side force
Results are also included in Figure 12 from tests at 16 knots without the dagger-board. The resistance is significantly higher than at 15 knots but this is partly due to the higher displacement from the ballast condition shown in Table 2. The slope of the linear fit through the data is however significantly lower than at 15 knots, which represents the reduced induced drag at higher speeds. This can be partly attributed to the lower lift coefficient on the keel to produce the required side force. The yacht is also operating in a semi-displacement mode at 16 knots, with an associated Froude number of 0.61, and its trim angle increased by approximately 1 degree and it’s heeled asymmetric waterplane also contributed to the side force, although with the tilted keel angle the sailing side force was produced with close to zero leeway, similar to the result from the 1:7 scale tank tests.
The curved dagger-boards could also be tilted, in a similar manner to the canting keel. This tends to load the curved tip of the dagger-board, increasing its vertical lift in relation to its sideforce. An example of results from these tests is shown in Figure 13 and it can be seen that increasing the tilt increased the resistance.
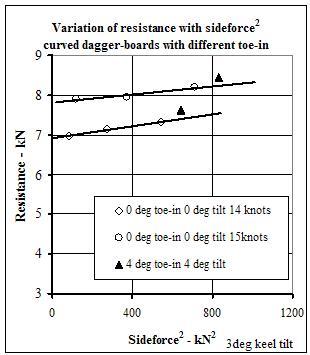
Figure 13 – Variation of resistance with side force for the curved dagger-boards with tilt
The relative loading on the keel and dagger-board was also monitored during the tank tests using strain gauges to measure the bending moments and typical results are shown in Figure 14.
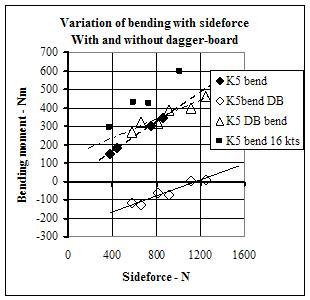
Figure 14 – Variation of keel bending moment with side force
The model scale bending moments from tests at 14, 15 and 16 knots are shown plotted against side force and linear trend lines have been fitted to the data. It can be seen that the data for 14 and 15 knots is distributed about a common line, although the leeway angles associated leeway angles differ. It can also be seen that the bending moment in the keel without the dagger-board is similar to the bending moment from the dagger-board with the keel, indicating that the keel generates the side force in the absence of a dagger-board. There were negative bending moments in the keel at lower values of side force with the dagger-board installed, which was similar to the CFD results shown in Figure 6.
7. UPWIND OPTIMISED STRAIGHT, VERSES CURVED BOARDS
The previous sections describe the background necessary for an understanding of how we undertook the tests and how these led to the results related directly to the comparison of straight upwind optimised, verses curved boards.
Having established from Figure 12 that the additional drag of the curved dagger-board being used for lifting the hull for a given required side force was substantially greater than that of a hull with dagger-board raised at 14, 15 and 16 knots, testing was then undertaken with an upwind optimised straight board at 9, 11 and 13 knots. The results are highlighted in Figure 11.
The difference in vertical lift between the straight and curved dagger-boards was obtained from model scale heave measurements made in the tank and an example is shown in Figure 15. It can be seen that the heave change from static is negative, indicating that the hull has sunk as a result of its wave pattern. The heave becomes less negative with increasing sideforce due to the associated increase in vertical force and it can be seen that the curved dagger-board reduced the sinkage of the model by approximately 5mm.
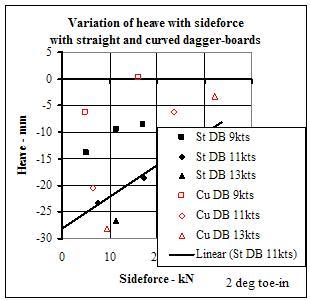
Figure 15 – Variation of heave with side force between straight and curved dagger-boards
At nine knots of boat speed which would be a very low speed, associated with 8 knots of true wind as shown in Table 1, for a dagger-board to be deployed there was little difference between the drag at equivalent side force and leeway of a curved and upwind optimised straight dagger-board. The difference was more pronounced at higher speeds.
Testing was also undertaken at side loads greater than those capable of being developed by an Open 60 at any reef or ballast condition. In Figure 16, which contains data from the higher stability condition of 22.5 degrees heel, it can be seen only at a sideforces greater than 25 kN or sideforce squared of 625, did the curved dagger-board show signs of less induced drag. This could be attributed to the vertical lift from the board causing a reduction in the resistance of the hull sufficient to overcome the increased induced drag of the foil and so be more efficient.
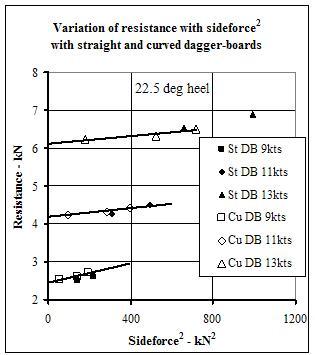
Figure 16 – Variation of resistance with side force between straight and curved dagger-boards at 22.5 degrees heel
Although the differences in total resistance are small, the conclusion was that the straight board, optimised to develop side force upwind over all wind angles and wind speeds, was more efficient over a curved board or a straight board with an equivalent dihedral angle.
This result has also assumed that boards are of equivalent weight and so given the requirement that the IMOCA rule requires boards to be in the raised position when measured, result in the same bulb weight. This is not the case however. The curved or heavily angled dihedral board needs to be longer to generate the same side force. The increase in board weight related to length is negligible however compared to the increased weight of board (and internal structure of the yacht) required to allow a board to be used at higher reaching boat speeds. For example; engineering a board at stall, at a boat speed of sixteen knots as opposed to a speed of thirteen knots would require a 50% increase in design load. There are significant drivers therefore, discounting potential damping effects of curved boards in waves ,to keep dagger-boards in IMOCA 60’s as light as the their required performance envelope will allow.
8. CONCLUSIONS
The combination of tank tests and CFD panel codes enabled a wide range of appendage test configurations to be investigated across a wide range of speeds. The 1:7 scale tank tests were used to compare hulls but also provided information on the beneficial reduction in resistance at semi-displacement speeds due to tilting the fore and aft axis of the canting keel.
The CFD panel code calculations provided information on the relative loading of the keel and dagger-board for the upwind sailing condition with variations of toe-in angles and keel tilt, albeit at fixed trim. The results of which were used to develop appendages and a test matrix for 1:3 scale model testing, cross-check/verify results during testing and refine dagger-board design post testing.
The 1:3 scale tank tests produced similar results to the CFD calculations for the upwind keel and dagger-board combinations, mitigated risk in decision taking and provide substantial confidence in the decision taken regarding the dagger-board selection and the keel tilt angle for the Open 60,
Acciona
.
Although in ORMA 60’s, where lift producing devices clearly work well, in IMOCA 60s one is operating at considerably lower side forces (proportional to righting moment) and at higher displacements. The relationship therefore between additional induced drag from a lifting foil and the reduction in displacement of the hull are quite different. We were able to show in Figure 16 that only at an unrealistic value of side force were we able to produce a situation whereby an IMOCA 60 would benefit in reaching conditions in flat water from utilising lift inducing dagger-boards.
That being said, from a practical point of view, the percentage deltas/differences between dagger-boards that are designed to provide lift as opposed to boards optimised for upwind use are not so significant that they would detract significantly from the performance of a yacht in a range of conditions. The final conclusion for the
Acciona
team was that there appeared to be no likely performance driven reason to select a heavier more expensive dagger-board type.
Acknowledgements
The work in this paper was commissioned by Owen Clarke Design as part of their ongoing research and development programme into IMOCA60 design development and acknowledgement is given for their permission to publish.
Thanks are also given to the staff at CEHIPAR and ACCIONA for their assistance in conducting the 1:3 scale tests.
For more information on the design process go to:
Naval Architecture
RETURN TO: Home Page - Performance yacht design 101
To receive postings of future articles find and LIKE us at:

References
-
Ward B. & Cochran C., “Development of the Volvo Ocean 65”, 21
st
Chesapeake Sailing Yacht Symposium, Annopolis MD USA, March 2013
-
Campbell, I., Owen M. Oliver C.& Provinciali G., “Tuning of appendages for an IMOCA60 yacht”,
4
th
High Performance Yacht Design Conference
, Auckland NZ 2012
-
Claughton. A R & Oliver C (2004), “Design considerations for canting keel yachts”,
18th International HISWA Symposium on “Yacht Design and Yacht Construction”
, Amsterdam, 2004
-
Campbell, I., Robinson, J. & Brown, M (2002), “The accuracy and repeatability of tank testing from experience of ACC yacht development”,
High Performance Yacht Design Conference
, Auckland, New Zealand, RINA, December 2002
-
G. Delhommeau (1993) “Wave resistance code REVA”,
Cours de la 19th WEGEMT School,
Ecole Centrale de Nantes, Septembre 1993.
-
G. Delhommeau (2002), “La simulation mécanique en hydrodynamique : application en ingénierie navale",
Chapitre 9, pp. 277-329, "CAO et simulation en mécanique"
, Editions Hermès, Lavoisier, 2002, ISBN 2-7462-0340-5.
-
Maes F. (2006), “An experimental study of the hydrodynamics of a yacht with a canting keel and forward rudder”,
19th International HISWA Symposium on “Yacht Design and Yacht Construction”,
Amsterdam, 2006.